The analysis of scrolling behavior on the website is possible in both tabular report form (Scrollmap Report) and as a heatmap (Scrollmap).
By default, etracker Analytics automatically measures the entire length of a page and records how far and long visitors scroll down (scroll depth) for a sample in steps of 25% each (i.e. 25%, 50%, 75% and 100%).
This helps determine which elements of the page can be seen by visitors and how long sections appear in the visible area. This is important for identifying UX optimization potential and increasing conversions. The scrollmap (also called scroll heatmap) offers the great advantage that scrolling behavior can be viewed directly in the context of the respective page content. The scrollmap report, on the other hand, provides additional segmentation options to understand the interaction with the page in more depth.
1. Use of the scrollmap
The Scrollmap can be reached in three ways:
1. Via the basic Pages report and clicking on the scroll icon.
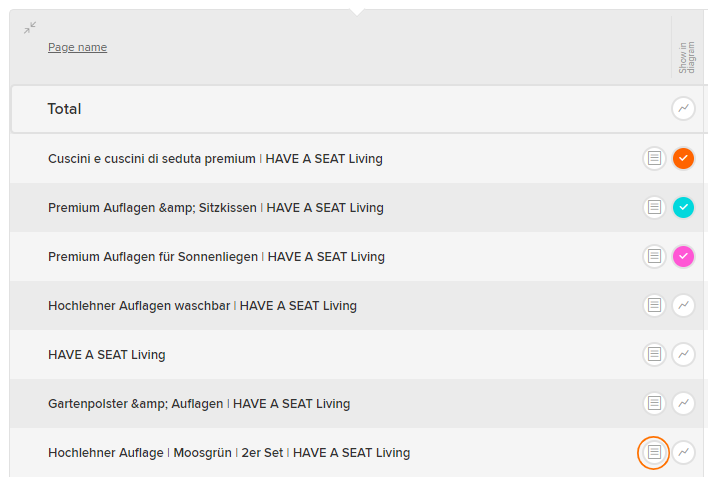
2. Via the Scroll map report under UX Analytics → Scroll map report and click on the scroll icon.
3. Directly via the Scrollmap menu item at UX Analytics → Scrollmap.
Options 1 and 2 are particularly useful when analyzing pages (such as landing pages) that are not accessible via the website menu.
Important!
If the scrollmap is not displayed, please check the Content Security Policy (CSP). Further notes on this.
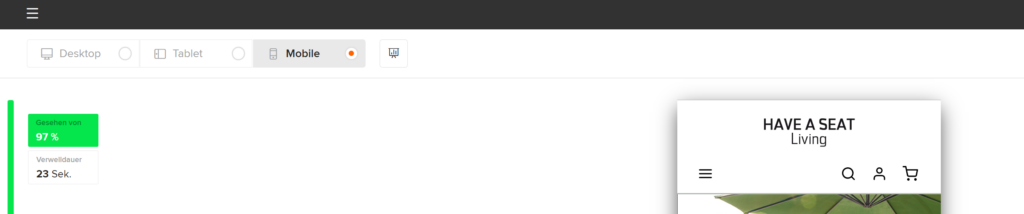
In the scrollmap, you can switch between the views for desktop, tablet, and mobile. The report icon displays the most important key figures for the respective page. The website is fully navigable, so that links, etc. can be used as usual to call up other pages.
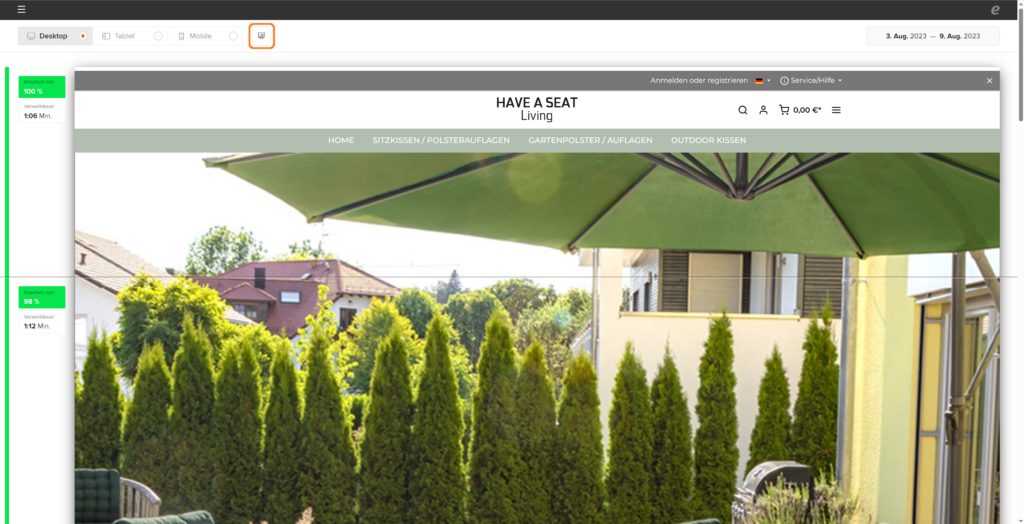
It is not uncommon that the top section does not display full 100%. This is because visitors can also jump directly to lower sections using appropriate jump labels. Or they scroll so fast that the etracker code is not yet fully loaded. This is often the case, especially on mobile devices, when directly visible content is very limited.
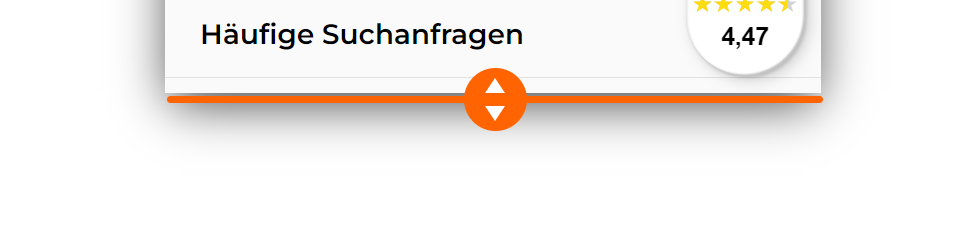
For particularly “long” pages, the initial representation of the page may be cut off. In this case, simply drag the virtual end of the page over the middle circle with the two down arrows:
2. Using the scroll map report
Go to UX Analytics → Scroll map report to open the report.
Tip
For longer page labels, feel free to use the option to widen the Dimensions column:
The usual functions are available in the report, such as
- Timeframe selection
- Sorting
- Filtering
- Expanding pages
- Views
- Exports
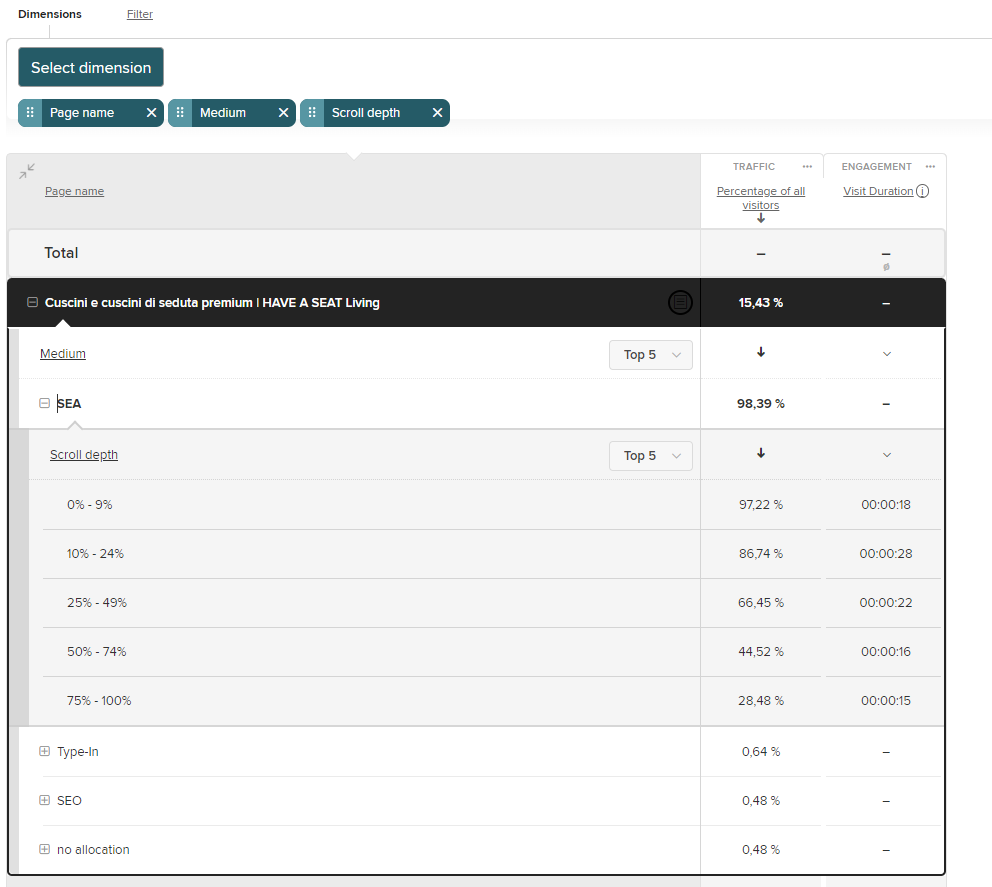
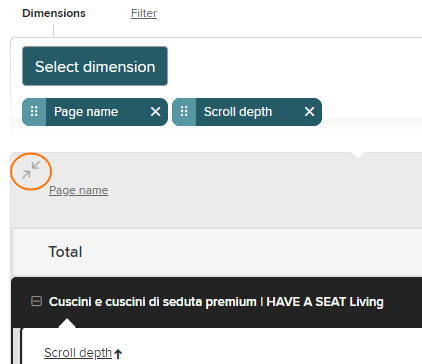
The drill-down function is especially useful by adding more segment dimensions:
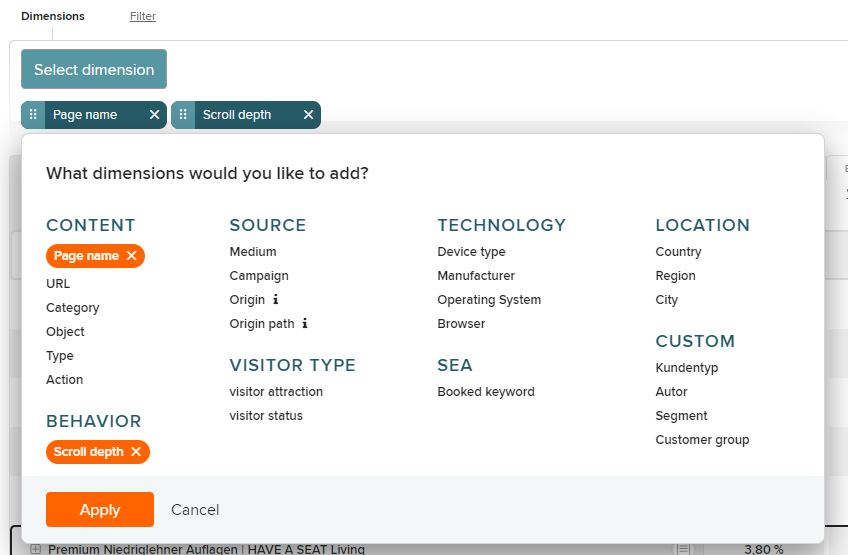
This allows, for example, scrolling to be viewed and compared specifically for the SEA channel: