The etracker Analytics Dashboard provides a direct overview of all relevant KPIs and changes. It is designed responsively so that it can be accessed via desktop, tablet or smartphone.
The dashboard essentially offers information on these three areas: hit quota and edition, KPI performance and top lists. The top bar also contains the following information
- the number of visitors currently on the website,
- the period selection (by default, the last seven days are displayed in comparison with the respective previous month period),
- the switch for changing between light and dark mode,
- the dashboard update and
- the configuration of KPIs and selection of absolute or percentage values for the metrics in the details and top lists.
The hit quota includes all measured page views and events as well as external campaign redirects and ad views. The automatic scroll measurement, campaign clicks and the ecommerce event “Product viewed” are excluded from the hit measurement.
By clicking on the respective KPI tile, the associated details, i.e. the temporal course and the shares by country, medium and device type, are displayed.
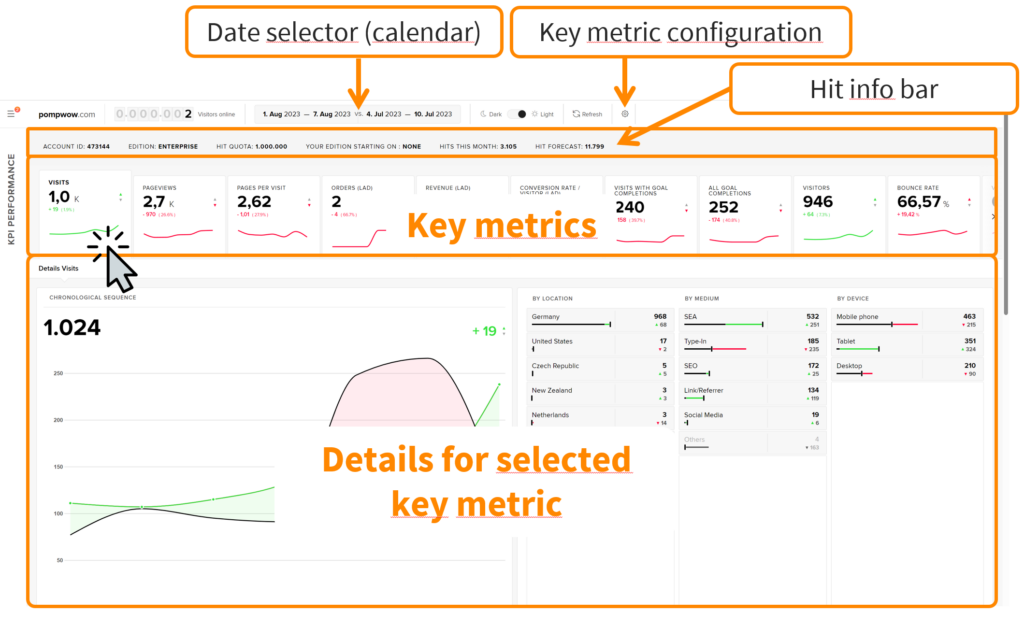
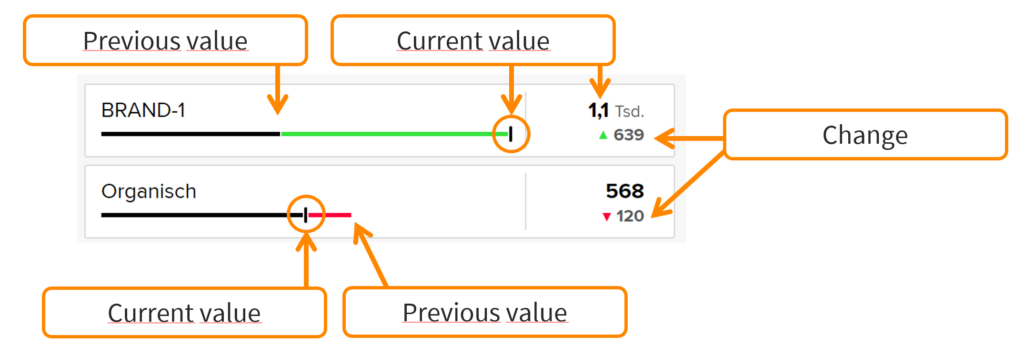
The total value and the change compared to the reference period are displayed for each of the specified key figures. The color coding indicates at a glance whether the key figure value has increased or decreased. If the color is red, the development is negative, and if the color is green, the development is positive. For example, an increase in the bounce rate is shown negatively, while an increase in visitors is to be considered positive.
The top lists can be used, for example, to display the most visited pages and most successful campaigns. Using the drill-down menus within the respective top list, it is possible to freely select the desired key figure and dimension according to which the top list is to be sorted. This allows the top lists to be adapted to the user’s own wishes and needs.
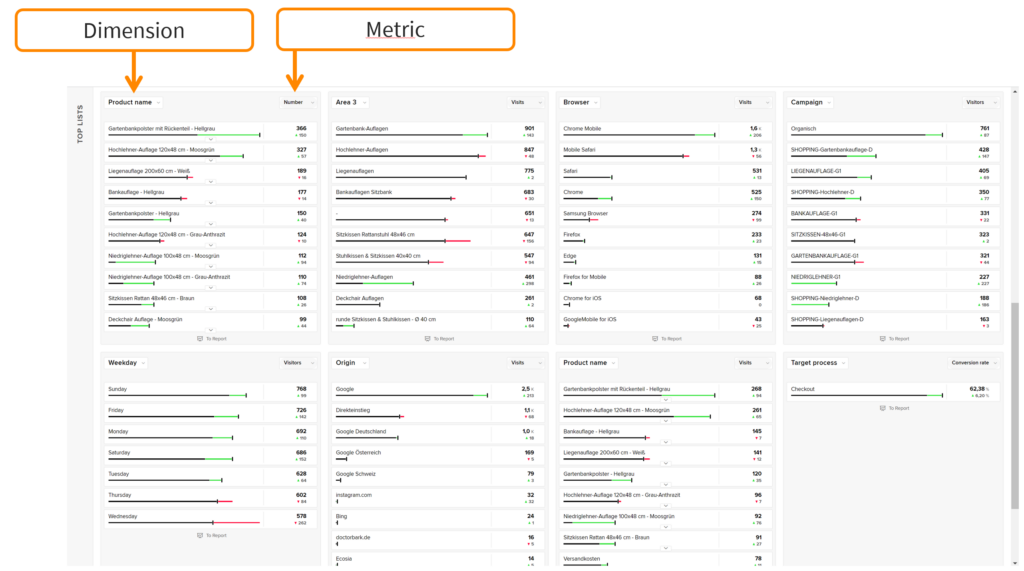
To dive deeper into the analysis of the developments, simply click on the button at the bottom of the respective top list to switch to the corresponding full report.