Tips & Tricks
2 min Reading time
by Katrin Nebermann
The graphical representation of the click paths provides a good insight into the navigation behavior of the users and thus into the page flow. To maintain clarity, the top 5 or 10 flows per selected page are displayed. For more in-depth path analyses, we recommend using the click path table. You can do this as follows:
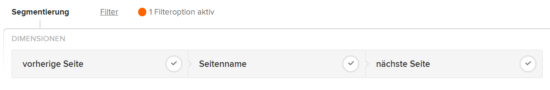
1. activate all three dimensions in the table.
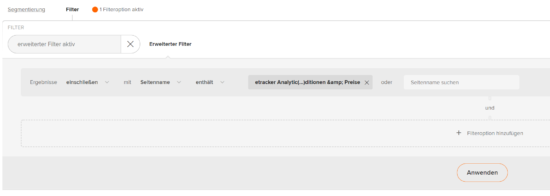
2. filter the entries on the page to be examined using the advanced filter.
You will now see all path combinations for the selected page in the table, including the previous and next page as well as entry and exit points.
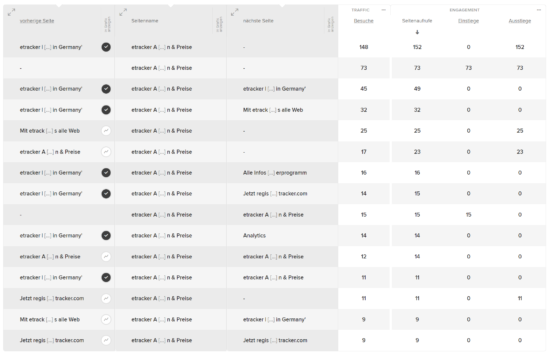
If there is no entry for the previous page or if it contains a dash (“-“), these are entries on the selected page. If there is no entry for the next page or if it contains a dash (“-“), these are exits after the selected page. Both key figures are displayed. The number of page views corresponds exactly to the frequency of the path combination shown in the table.
Examples:
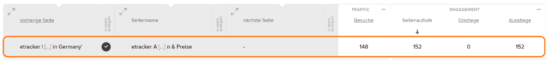
In the selected period, 148 visitors switched from the homepage to the price page 152 times and then left the website:
Here, the registration page was accessed 15 times out of 14 visitors from the homepage via the pricing page:
