Tips & Tricks
2 min Reading time
by Katrin Nebermann
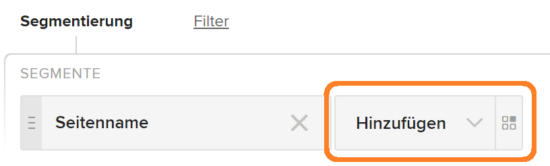
We have made the reports even more dynamic. So far, data exploration has been super easy. You simply went into any report and added up to five additional segment dimensions.
Depending on what your question was. For example, whether the bounce rate on a particular landing page varies greatly depending on the campaign and device type – i.e. desktop versus mobile.

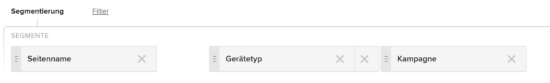
You could also simply change the perspective by dynamically changing the order of the additional segment dimensions using drag & drop with the mouse.
The only limitation of the exploration: the first dimension was previously fixed. If you wanted to analyze the bounce rate by device type or medium across all pages, the only way to do this was to use the filter function, for example. to desktop users.
Now, however, you are completely free and can also drag the standard dimension – in this example the side – to the second etc. position. position. This means that a wide range of questions can be answered even more quickly. There are therefore no longer any limits to data mining in the search for valuable insights. Anyone can awaken the reporting ninja in them with the completely free configuration.