Tips & Tricks
2 min Reading time
by Katrin Nebermann
When looking at web analytics metrics, the focus is on whether the respective key figure has changed positively or negatively. There are three ways to determine this in etracker analytics:
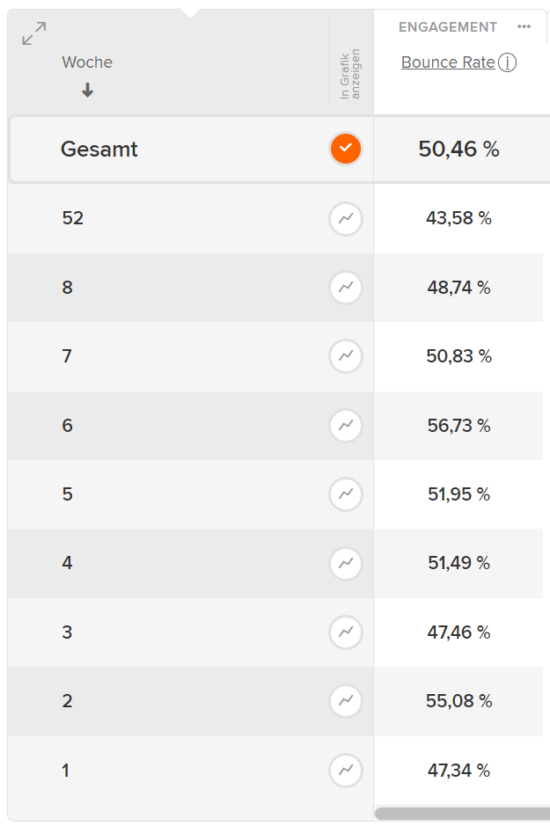
You can see the respective bounce rates in the report at weekly level. In our example, these fluctuate slightly and are currently just below the average for the overall period under review.
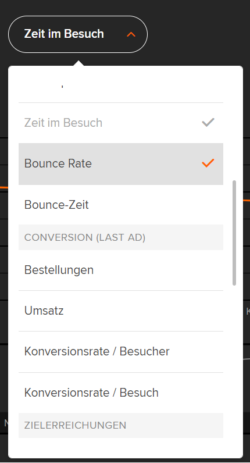
By selecting the key figure in the report graph, you can also view the change over time as a line graph. It is often easier to identify changes visually, especially long-term trends and rhythms.
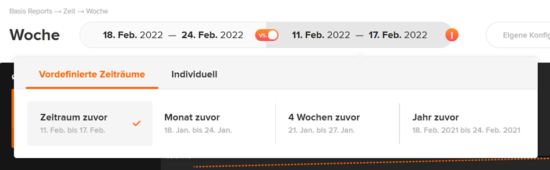
You can also activate a comparison via the date selection by clicking on the “versus” slider and optionally adjusting the desired comparison period. The comparison period selection opens by clicking on the period field on the right
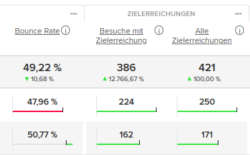
If you then move the mouse over the respective line in the table, the comparison view switches between bar display and display in absolute and percentage changes: