Tips & Tricks
1 min Reading time
by Katrin Nebermann
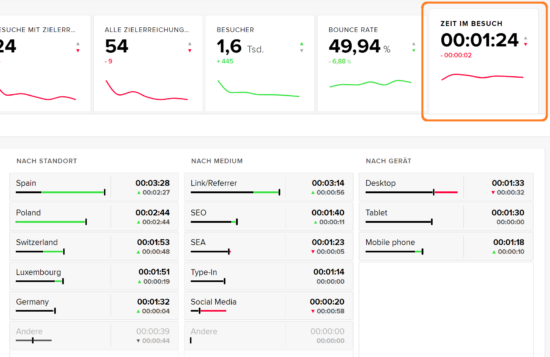
Dwell time is an important engagement metric. It is therefore naturally available as a KPI in the dashboard and can also be viewed by country, source medium and device type simply by clicking on it. In our example, visitors from Spain and coming via organic links take the most time.
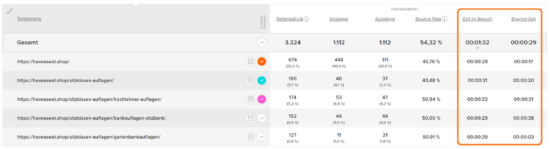
However, this is not the only way to investigate dwell time in more detail. It is available as a key figure in all standard reports and can therefore be used, for example, to calculate the at page level; and even again specifically for visitors who have only accessed one page (as bounce time).
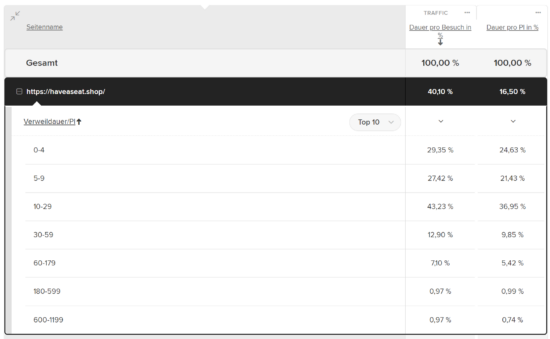
To analyze even deeper at page level, you can include various segments as dimensions in the report. Breaking it down to the various time intervals can also be informative, as it is well known that the average only provides limited information about the actual distribution. Here you can see that most users spend between 10 and 29 seconds on the homepage.
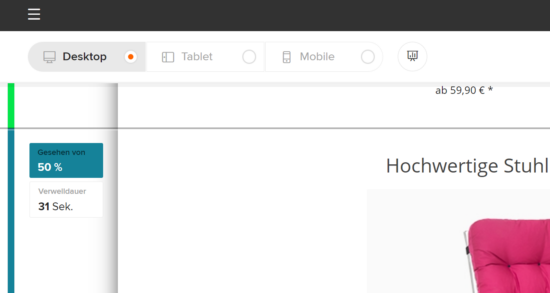
The scroll map or the associated report shows the dwell time by individual segments of the page in an even more granular way, i.e. which section of the website was in focus for how long and how many users scrolled to a certain section in the first place.
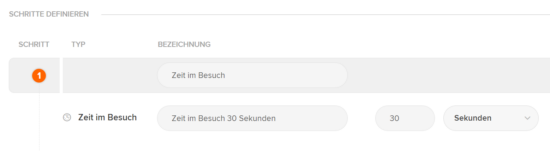
It is also possible to define a specific (or several) dwell time(s) as a conversion target and evaluate campaigns accordingly. You can easily define the corresponding goals using the goal wizard in the respective account:
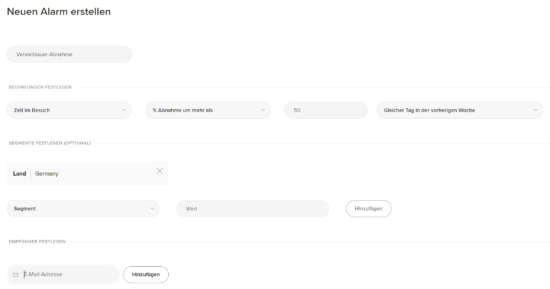
Last but not least, by setting up an alarm , you can also be notified if, for example, the length of stay drops dramatically compared to the previous week for visitors from Germany:
Now you just have to think about how to increase the length of stay. It is important to remember that dwell time is usually only one of several indicators for the attractiveness of content or the quality of campaign traffic.