Make report dimensions easier to read
Tips & Tricks
![](https://www.etracker.com/app/uploads/2024/05/etracker-analytics-wissen-thumbnail-12-1.webp)
by Katrin Nebermann
Make report dimensions easier to read
![](https://www.etracker.com/app/uploads/2022/02/Dimensionsanzeige-250x351-1.png)
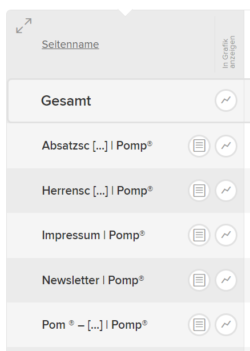
By default, the dimensions column is kept slim in order to leave as much space as possible for displaying the key figures. However, this can lead to the entries being cut off.
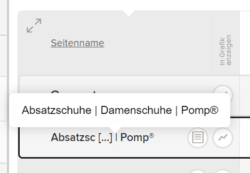
To see the full name, you can display the respective entry by moving the mouse over it.
![](https://www.etracker.com/app/uploads/2022/02/Dimensions-Mouseover-250x173-1.png)
![](https://www.etracker.com/app/uploads/2022/02/Dimensionsanzeige_breit-550x302-1.png)
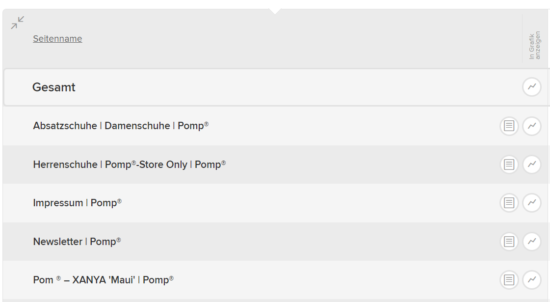
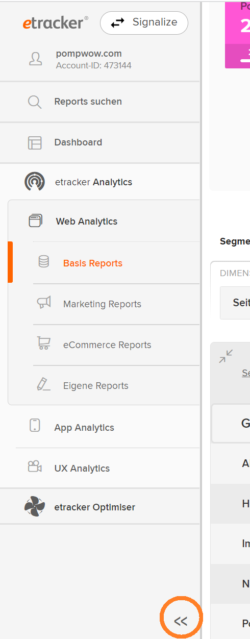
Alternatively, simply click on the two arrows at the top left of the dimension column and the column will widen.
If the screen width is then no longer sufficient to display the table properly, the report area can be widened by minimizing the report menu using the arrow at the bottom left.
![](https://www.etracker.com/app/uploads/2022/02/Menue_einklappen-250x639-1.png)
More on the topic
Tips & Tricks
2
Minutes
Reading time
Tips & Tricks
2
Minutes
Reading time
Don’t worry about the end of cookies in the Google Chrome browser in 2024