Tips & Tricks
1 min Reading time
by Katrin Nebermann
In the etracker analytics reports, the diagram is displayed above the table by default. But this can now be quickly changed with this new setting:
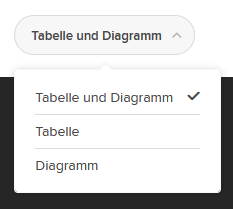
This new setting is just as advantageous for analysis via the user interface as it is for PDF reports that are sent by e-mail. If you work primarily with the table in the user interface, you can simply hide the diagram and save yourself the trouble of scrolling to the table.
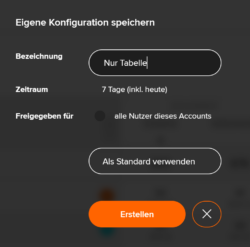
Of course, the desired setting can also be saved: Make the desired setting, then click on Save own configuration, assign a name, define a time period and release and finally declare this as the standard – done.
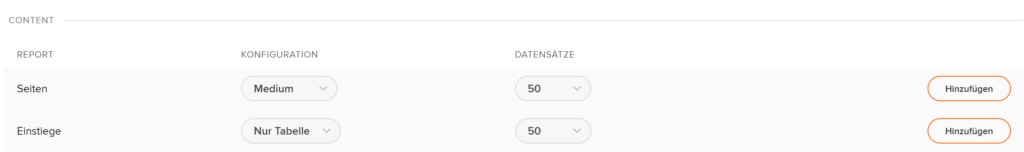
Report configurations – i.e. only chart or only table – can also be used for automatic PDF reports in order to display either only the chart or only the table. As soon as the appropriate configuration has been created for each report, it can be accessed when creating the PDF report.